Financial Update Indonesia: Credit Growth, Bad Loans and Retail Sales
The central bank of Indonesia projects non-performing loans (NPL) to rise to 2.4 percent of the country’s total outstanding loans by the end of the year, significantly up from 1.8 percent at the end of last year. Despite the acceleration of bad loans in Indonesia, the institution stated that it is still manageable. Meanwhile, loan growth in Indonesia is estimated to slow to 11 or 12 percent (y/y) by the end of 2014 (the slowest pace since 2010), down from 21.4 percent (y/y) in 2013 primarily due to the central bank’s monetary tightening policy.
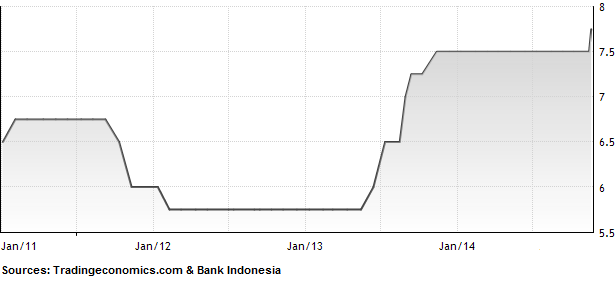
Indonesia’s central bank (Bank Indonesia) has implemented a tighter monetary policy in mid-2013 in an effort to safeguard macroeconomic stability. Amid the sluggish global economy (dragging down Indonesia’s foreign exchange earnings from commodity exports), severe capital outflows in the second half of 2013 (due to the US Federal Reserve’s winding down of the US bond-buying program), looming higher US interest rates in 2015 (which are expected to trigger another round of capital outflows from Indonesia), and internal rebalancing (raising prices of subsidized fuel prices in June 2013 and November 2014) in the context of combatting the country’s wide current account deficit and implement structural reforms to boost economic and social development, Bank Indonesia hiked its benchmark interest rate (BI rate) gradually from 5.75 percent in June 2013 to 7.75 percent in November 2014. This monetary tightening has slowed the pace of credit growth and is an important factor why Indonesia’s economic expansion has been slowing in the past two years. In fact, in the third quarter of 2014, GDP growth slowed to 5.01 percent (y/y), a five-year low. Most analysts agree, however, that sacrificing economic growth for financial stability is a good decision and enhances international confidence in Indonesia’s economy.
Bank Indonesia's BI Rate:

Indonesia's Quarterly GDP Growth 2009–2014 (annual % change):
| Year | Quarter I |
Quarter II | Quarter III | Quarter IV |
| 2014 | 5.22 | 5.12 | 5.01 | |
| 2013 | 6.03 | 5.89 | 5.62 | 5.78 |
| 2012 | 6.29 | 6.36 | 6.16 | 6.11 |
| 2011 | 6.45 | 6.52 | 6.49 | 6.50 |
| 2010 | 5.99 | 6.29 | 5.81 | 6.81 |
| 2009 | 4.60 | 4.37 | 4.31 | 4.58 |
Source: Statistics Indonesia (BPS)
Gross Domestic Product of Indonesia 2006-2013:
| 2006 | 2007 | 2008 | 2009 | 2010 | 2011 | 2012 | 2013 | |
| GDP (in billion USD) |
285.9 | 364.6 | 432.1 | 510.2 | 539.4 | 706.6 | 846.8 | 878.0 |
| GDP (annual percent change) |
5.5 | 6.3 | 6.1 | 4.6 | 6.1 | 6.5 | 6.2 | 5.8 |
| GDP per Capita (in USD) |
1,643 | 1,923 | 2,244 | 2,345 | 2,984 | 3,467 | 3,546 | 3,468 |
Sources: World Bank, International Monetary Fund (IMF) and Statistics Indonesia (BPS)
The projected 2.4 percent of NPLs at the end of 2014 is still within Bank Indonesia’s threshold level (< 5 percent) and thus considered manageable. Although forecasts for Indonesia’s economic growth in 2015 are still bleak (earlier this week the World Bank revised its growth projection to 5.2 percent from 5.6 percent previously), the central bank expects that bad loans will decline to 2 percent of total outstanding loans next year.
Indonesia’s October 2014 Retail Sales
Meanwhile, Indonesia’s retail sales slowed slightly to 17.6 percent (y/y) in October 2014 compared with 17.9 percent (y/y) in the previous month. A Bank Indonesia survey, which covers 650 retailers in 10 major cities, showed that the slowdown was brought about by weaker demand for cultural and recreational goods. It further suggests that Indonesia’s annual retail sales will continue to slow in November (although rising on a monthly basis). According to the survey, consumers are concerned about the inflationary pressures caused by the recent subsidized fuel prices hike. In mid-November 2014, the government raised prices of subsidized low-octane gasoline and diesel by more than 30 percent. As a result, inflation accelerated to 6.23 percent (y/y) in November 2014.
Inflation in Indonesia:
| Month | Monthly Growth 2013 |
Monthly Growth 2014 |
| January | 1.03% | 1.07% |
| February | 0.75% | 0.26% |
| March | 0.63% | 0.08% |
| April | -0.10% | -0.02% |
| May | -0.03% | 0.16% |
| June | 1.03% | 0.43% |
| July | 3.29% | 0.93% |
| August | 1.12% | 0.47% |
| September | -0.35% | 0.27% |
| October | 0.09% | 0.47% |
| November | 0.12% | 1.50% |
| December | 0.55% | |
| Total | 8.38% | 5.75% |
Source: Statistics Indonesia (BPS)
Bahas
Silakan login atau berlangganan untuk mengomentari kolom ini

